Aggregator Networks in Soccer Markets: Tracing Shifts to Identify Clustered Value Opportunities Worldwide
Global soccer betting relies on complex systems where aggregator networks pull together odds from multiple bookmakers and exchanges, and these networks help surface patterns that point to value clusters in shifting markets. Data indicates that such networks operate by continuously monitoring price movements across dozens of operators, which allows analysts to spot divergences that arise during major tournaments or league weeks.
How Aggregator Systems Collect and Process Soccer Odds Data
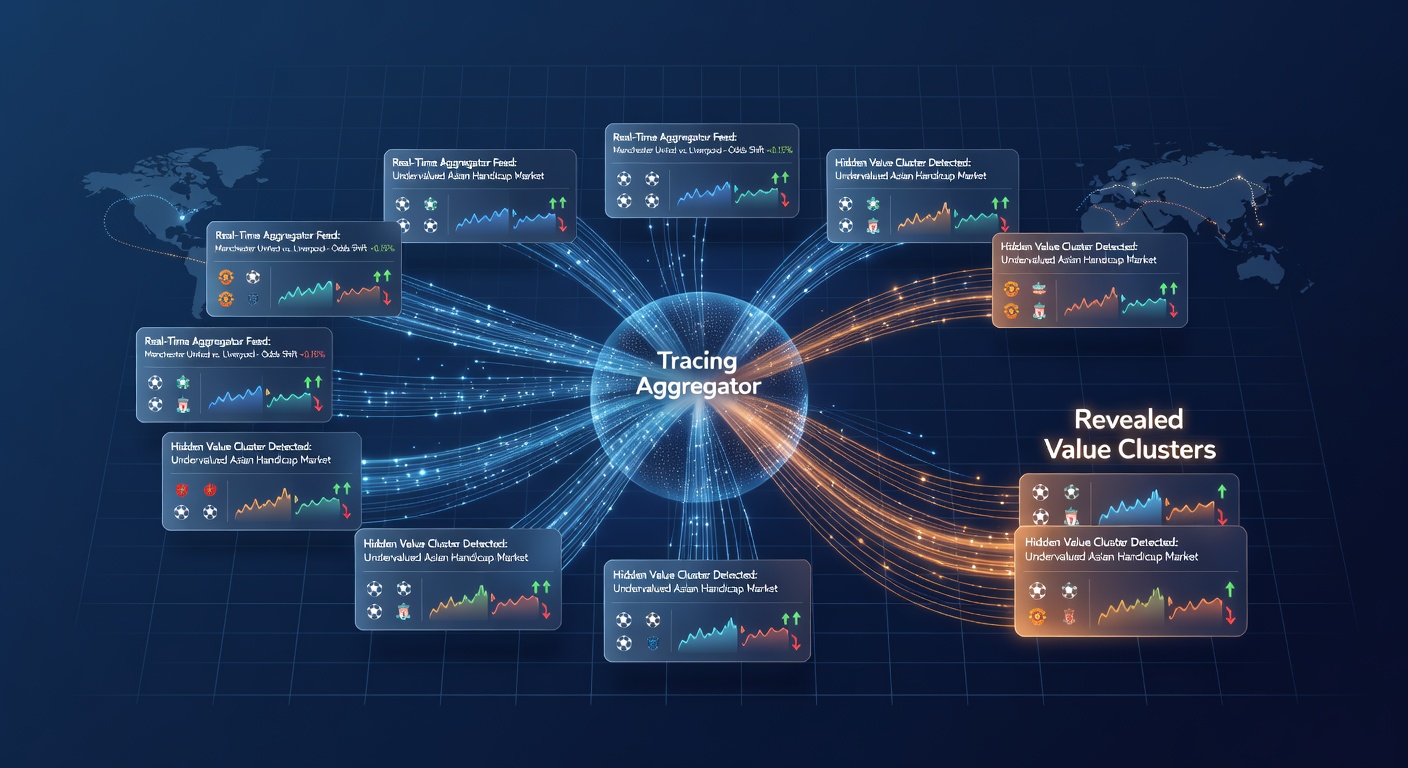
Aggregators function as central hubs that receive live feeds from international betting platforms, and they compile these inputs into unified datasets for comparison. Researchers note that the process involves timestamped records of each odds change, which reveals clusters where multiple operators adjust prices in similar directions yet leave gaps that persist for short windows. In May 2026 observers recorded heightened activity in European leagues where such clusters appeared more frequently during midweek fixtures, and this timing aligned with fixture congestion that often drives rapid repricing.
Networks track not only the numerical shifts but also the volume of bets placed at each level, while they cross-reference these figures against historical baselines. According to reports from the European Gaming and Betting Association, operators in several regions updated their models in early 2026 to account for faster data propagation, and this adjustment reduced the duration of certain value clusters by roughly fifteen percent in tracked markets.
Identifying Hidden Value Clusters Through Network Analysis
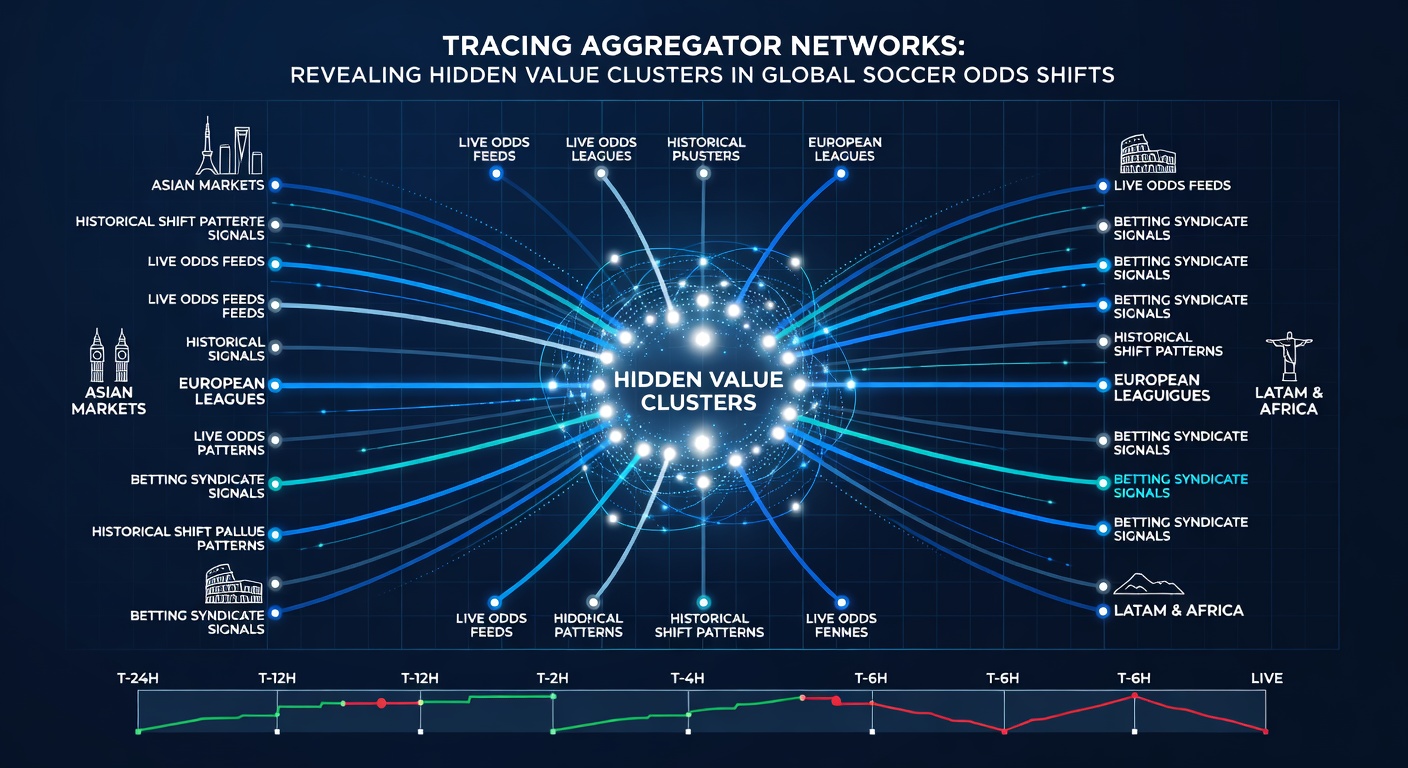
Value clusters emerge when odds across different platforms converge around a narrow range yet remain offset from statistical models that predict true probabilities. Experts observe that aggregators flag these zones by applying filters for liquidity and movement speed, which isolates areas where informed bettors might locate edges before broader market correction occurs. One study from the University of Sydney's gambling research unit found that soccer matches in Asian leagues produced the most consistent cluster formations during evening sessions, and these patterns held across multiple seasons when cross-checked against exchange data.
But here's the thing: the detection process requires integration of live feeds with historical volatility measures, and networks that combine both elements tend to highlight clusters tied to specific event triggers such as red cards or weather changes. Figures from the American Gaming Association show that soccer accounted for over forty percent of tracked arbitrage activity in North American platforms during the first quarter of 2026, and much of that volume traced back to aggregator-identified discrepancies in major league games.
Regional Variations in Odds Movement and Aggregator Reach
Soccer markets in South America display different shift dynamics compared with European counterparts, and aggregators adjust their scanning parameters accordingly to capture local liquidity patterns. Data shows that South American leagues often produce clusters centered on draw outcomes during high-stakes derbies, whereas European fixtures tend toward over-under totals when injury news breaks late. Networks operating across both regions maintain separate alert protocols, which helps maintain accuracy when time zones create staggered information flows.
Those who've examined aggregator performance note that coverage gaps still exist in smaller African and Oceanian competitions, and these gaps can delay cluster detection by several minutes. Industry reports compiled by the Asia Pacific Association of Gaming Regulators indicate that expanding aggregator reach into these markets has become a priority for operators seeking broader arbitrage windows, and early pilots in 2026 demonstrated improved detection rates after new data partnerships formed.
Technical Tools That Support Network Tracing
Modern tracing relies on API connections that pull real-time updates from bookmakers, and these connections feed into visualization layers that map cluster locations across leagues. Analysts use heat-map overlays to identify recurring value zones, while they apply machine-learning filters to distinguish noise from genuine movements. The result appears as actionable clusters that persist long enough for position sizing, and networks continue refining their models based on post-match outcome data.
What's interesting is how these tools scale across different bet types, including both match-winner and player-performance markets. Aggregators that handle multiple bet categories simultaneously tend to reveal interconnected clusters where a shift in one market influences pricing in related areas, and this interconnectedness adds layers to the tracing process that single-market scanners often miss.
Conclusion
Aggregator networks continue to evolve as central components in soccer odds analysis, and their ability to reveal hidden value clusters stems from systematic data aggregation across global platforms. Evidence from multiple regions demonstrates that consistent monitoring of shift patterns provides structured insights into market behavior, while ongoing technical improvements expand the scope of detectable opportunities. Those monitoring these systems in May 2026 and beyond will likely see further integration of regional feeds that sharpen cluster identification even in less liquid markets.