Algorithmic Cross-Checks: How Bettors Employ Comparison Matrices and Projection Tools to Lock in Edges Before Lines Converge
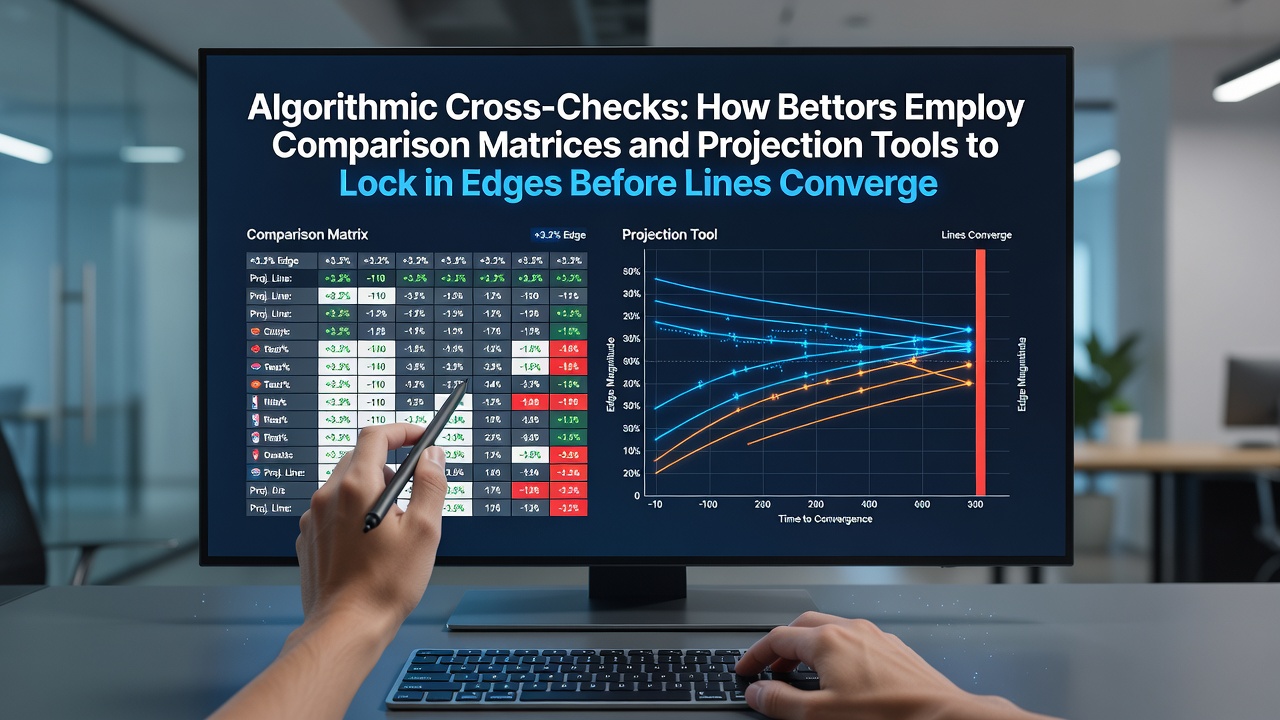 Bettors have turned to algorithmic cross-checks that combine comparison matrices with projection tools to identify pricing inconsistencies across sportsbooks before market lines adjust and converge. These methods rely on structured data analysis rather than intuition alone, allowing systematic evaluation of odds from various operators while projecting probable outcomes through statistical models. Research from industry reports shows that such approaches gained traction as digital platforms expanded access to real-time data feeds, and observers note increased adoption among those tracking multiple leagues simultaneously. Comparison matrices function as tabular frameworks that align odds from different bookmakers side by side, highlighting variances in implied probabilities for the same event. Projection tools layer statistical forecasts onto these matrices, drawing from historical performance data, player metrics, and situational variables to estimate true probabilities. When the projected value exceeds the offered odds by a measurable margin, bettors can flag potential edges while the discrepancy still exists.
Data Aggregation and Matrix Construction
Operators collect odds through APIs that pull live information from dozens of sportsbooks, then populate matrices with columns for each provider and rows for specific markets such as moneyline, spread, or total points. Automated scripts refresh these grids at intervals ranging from seconds to minutes, depending on the sport and volatility level. In June 2026, updates to data licensing agreements between several North American platforms and European data providers expanded the number of available feeds, which in turn allowed matrices to incorporate additional international books without manual intervention.
Those who maintain custom matrices often apply weighting factors to account for bookmaker liquidity and historical accuracy, ensuring that thin markets do not skew overall readings. The resulting output ranks discrepancies by size and persistence, directing attention toward the widest gaps that have not yet narrowed.
Projection Models and Edge Calculation
Projection tools integrate regression analysis, machine learning classifiers, and simulation engines to generate probability estimates independent of market pricing. These models ingest variables such as team form, travel schedules, weather conditions, and injury reports, then output expected margins or totals that can be compared directly against matrix entries. When the tool assigns a 52 percent probability to an outcome priced at 48 percent implied probability by the sharpest book, the difference represents an edge that may persist until other operators adjust.
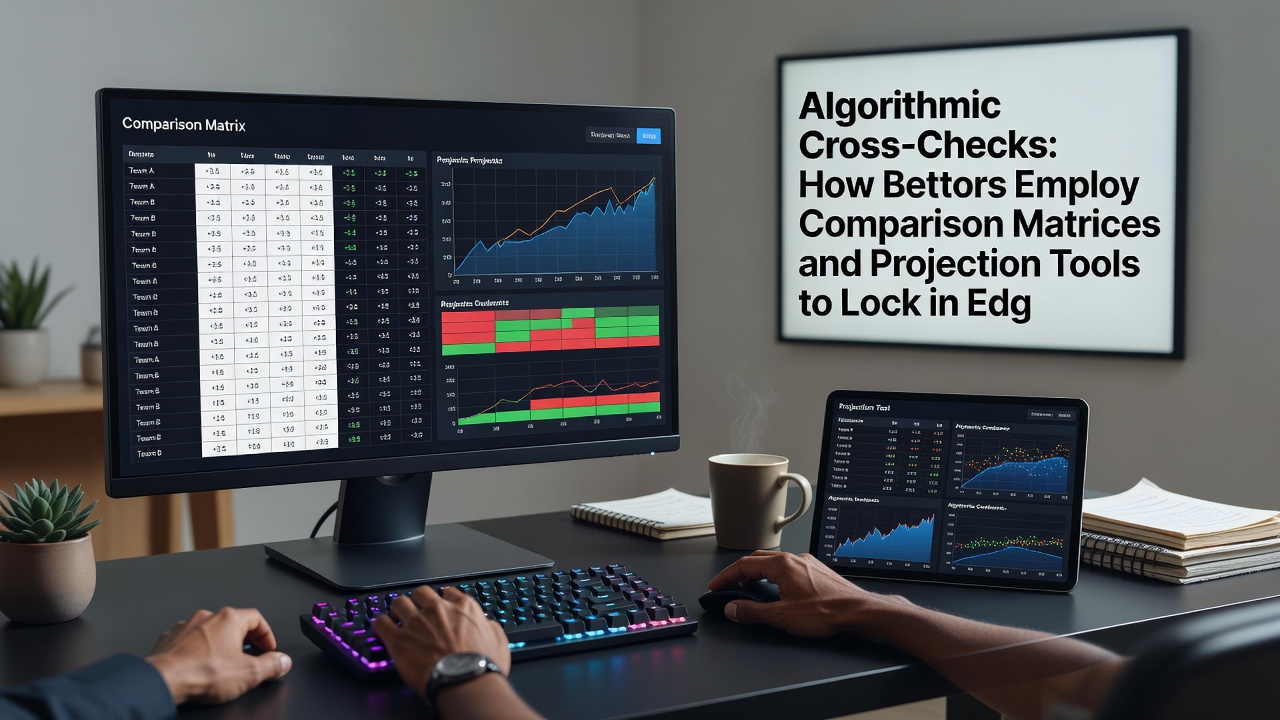
Validation studies published by academic researchers at institutions such as the University of Nevada, Las Vegas, indicate that calibrated projection systems achieve measurable accuracy improvements over baseline market averages in certain sports, though results vary by league and sample size. Bettors combine these outputs with matrix rankings to prioritize wagers that satisfy both statistical and pricing criteria before lines tighten.
Timing and Market Dynamics
Lines converge when sufficient betting volume reaches the sharpest books, prompting adjustments that reduce or eliminate discrepancies. Algorithmic systems monitor volume indicators and line movement velocity to estimate how long a given edge may remain available. In practice, this means executing decisions within narrow windows, often measured in minutes rather than hours, particularly for high-profile events where information disseminates rapidly.
Regulatory filings from the Nevada Gaming Control Board document steady growth in the number of licensed operators offering API access, which has indirectly supported faster data flows and more responsive matrices. Bettors who integrate these feeds report the ability to act on cross-check alerts before broader market participants react, preserving the calculated margin.
Integration with Risk Management Protocols
Successful application of these tools requires pairing edge identification with position sizing rules that limit exposure per market and across correlated events. Matrices can be extended to include bankroll allocation columns, while projection outputs feed into variance estimates that inform stake recommendations. This layered approach helps maintain consistency even when individual projections miss their targets.
Industry organizations such as the American Gaming Association have published summaries noting increased technology investment among betting operators, which in turn influences how quickly lines move once discrepancies appear. Those employing cross-check systems therefore prioritize speed of execution alongside accuracy of inputs to maintain viability over extended periods.
Conclusion
Algorithmic cross-checks that merge comparison matrices with projection tools provide a structured pathway for identifying and acting on pricing inefficiencies before lines converge. Data aggregation, model calibration, and timing awareness form the core components, supported by expanding access to real-time feeds across multiple jurisdictions. As platforms continue to evolve, the methods remain grounded in measurable inputs and documented market behavior rather than subjective judgment.