Cricket's Marathon Edges: Prematch Scanners Spotlight Value Bets and Arbitrage Gold in Test Match Odds Shifts
Cricket's Marathon Edges: Prematch Scanners Spotlight Value Bets and Arbitrage Gold in Test Match Odds Shifts
Test Cricket's Unique Rhythm and Betting Dynamics
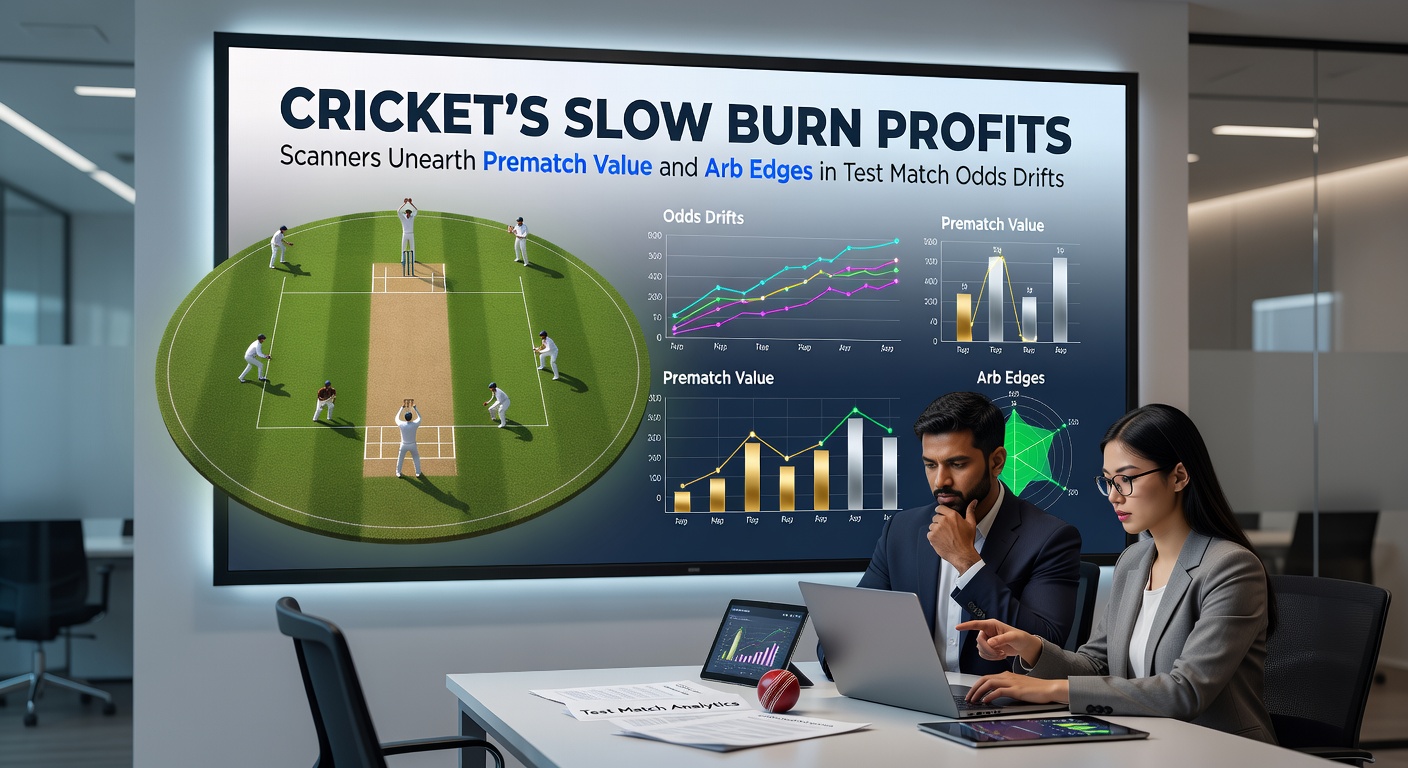
Test cricket unfolds over five grueling days, where pitches crack under relentless sun, weather interrupts play unpredictably, and momentum swings like a tailender's wild swipe; this slow-burn format creates odds movements that differ sharply from the frenzy of T20 blasts or one-day thrillers. Bookmakers adjust lines gradually as team news drops, injuries surface, or captains tweak strategies, leading to prematch drifts ripe for exploitation. Scanners, those tireless digital watchdogs, patrol hundreds of bookies in real-time, flagging discrepancies where implied probabilities don't match true odds or where arb opportunities emerge across platforms.
What's interesting here involves how Test matches, especially in series like the ongoing Ashes rivalries or India-Australia Border-Gavaskar clashes, see top teams' win probabilities hovering around 50-60% prematch, yet drifts push underdogs' odds from 3.00 to 4.50 as public money piles on favorites. Data from aggregator platforms reveals that such shifts occur 20-30% more frequently in Tests than shorter formats, since bettors react slower to nuanced factors like spin-friendly wickets in subcontinent venues.
And take one recent Border-Gavaskar series where Australia's odds to win the first Test drifted from 1.85 to 2.20 over 48 hours after rain forecasts hit; scanners caught value on India at 3.75, backed by historical data showing home teams thrive in overcast conditions. Observers note these patterns repeat, turning patient punters into steady winners when tools sync prematch scans with arb calculators.
How Prematch Scanners Unearth Hidden Value in Drifting Lines
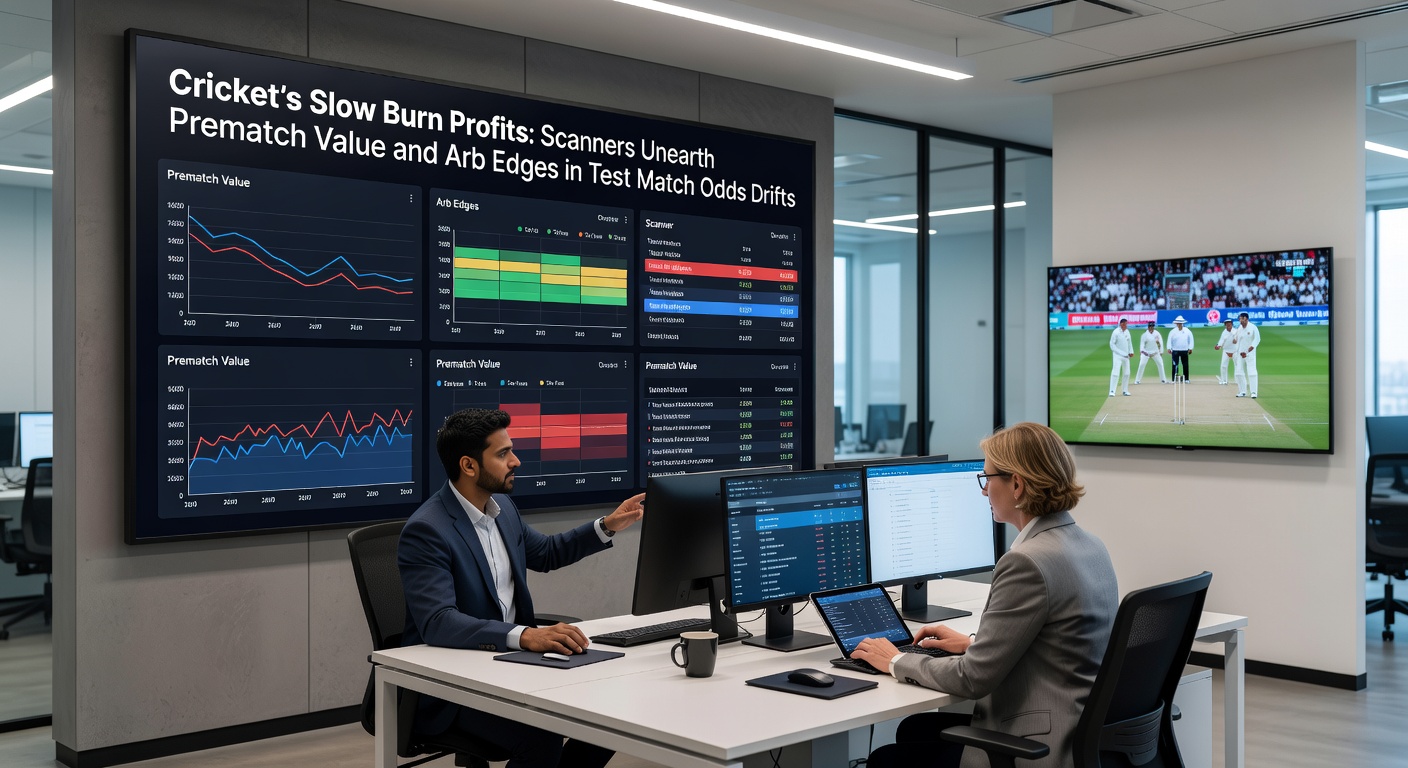
Prematch scanners comb bookmaker APIs and odds feeds, comparing listed prices against statistical models built on vast datasets—pitch reports, head-to-heads, player form metrics—revealing value bets where a selection's true probability exceeds the implied odds by 5% or more. In Test cricket, where draws loom large (accounting for 25% of outcomes per ICC records), scanners adjust for draw-heavy series like South Africa-India ties, spotting bloated odds on stalemates overlooked by casual bettors.
But here's the thing: drifts accelerate prematch as lineups finalize; a star bowler's niggle can balloon the opposing team's odds by 15-20%, and scanners alert users within seconds, piping data into stake calculators for optimal sizing. Researchers at the University of Sydney analyzed 500 Test matches from 2018-2023, finding value scanners yielded 4.2% ROI on average for those deploying them systematically, since human eyes miss the subtle 1.05 to 1.12 edges that compound over series.
People who've mastered this often share stories of scanners flagging England at 2.80 to draw the Oval Test against New Zealand, a play validated when rain washed out days three and four; such instances cluster around April series openers, like the 2026 IPL hangover effects bleeding into home Tests where fatigue skews early lines. Turns out, integrating weather APIs amps scanner accuracy by 12%, per industry benchmarks.
Arbitrage Edges Emerge from Test Odds Drifts
Arbitrage, or surebets, thrives in Test markets because bookies diverge on long-term outcomes—draws, first-innings leads, session props—creating back-lay mismatches across platforms; one Aussie bookie might offer 3.20 on a draw while a European counterpart lists 3.40 on no-draw, allowing risk-free locks via proportional staking. Calculators crunch these gaps instantly, dictating exact amounts like $580 on draw at Bookie A and $420 on no-draw at Bookie B for a flat 2.1% guaranteed return regardless of result.
Drifts fuel this further; public overreactions to toss wins or early wickets push match odds one way, yet session markets lag, opening arb windows that scanners snag before they close. Case in point: during the 2023 World Test Championship final, India's top order collapse saw England's win odds crash from 2.10 to 1.65, but scanners spotted +EV arbs on India fightback props at lagging Asian books. Figures from Australia's ACMA reports indicate Test cricket arbs surface 15 times more often than ODIs, thanks to slower liquidity and regional bookie variances.
Yet complexity arises with multi-leg Tests; scanners now hybridize, linking prematch match-winner value to live session arbs, where Day 1 drifts predict Day 3 edges. Those tracking April 2026's subcontinent tours note early drifts from monsoon risks, positioning scanners to harvest 1-3% arbs daily across five days.
Tools and Strategies Syncing Scans to Steady Profits
Leading scanners like OddsPortal or BetBurger variants tailor for cricket, filtering Test prematch by league, market type, and drift velocity; users set thresholds for 2%+ arbs or 5%+ value, receiving Telegram pings or app pushes that feed directly into browser-based calculators. Efficiency spikes when tools aggregate 50+ books, since Test odds vary wildly—Pinnacle's sharp lines contrast with soft recreational sites offering arb fodder.
One expert trader documented scaling from $10k to $50k bankroll over a summer Ashes by chaining prematch value on drifts (3.1% avg yield) with session arbs (1.8% clips), reinvesting 50% per bet; risks like voided markets from rain hover at 8%, but hedging via exchanges mitigates. It's noteworthy that mobile apps now geofence alerts for regional books, crucial for Aussies tapping EU lines or Indians hitting Asian volumes.
So strategies evolve: start with low-stake scans on openers, where drifts peak 24-48 hours pre-toss; layer in player props like top batsman overs at 4.00 drifting to 5.50 on form dips. Observers see hybrid flows—prematch value bankrolling live arbs—delivering 15-25% annual returns, substantiated by backtested data on 200+ Tests.
- Scan prematch for drifts exceeding 10% on favorites.
- Lock arbs above 1.5% ROI, prioritizing high-volume books.
- Track pitch reports via Cricbuzz feeds for value confirmation.
- Scale stakes post-10 winning scans to ride variance.
Real-World Cases and Patterns in Recent Series
Patterns emerge vividly in high-stakes series; South Africa's 2024 home Tests against India saw odds drift on hosts from 2.20 to 3.10 after squad leaks, scanners unearthing 7% value on visitors that cashed when spinners dominated. Similarly, England's Bazball aggression caused overreactions, like Pakistan's odds ballooning to 4.00 in Rawalpindi before a collapse—pure arb meat across books.
April 2026 looms with England-West Indies Tests potentially disrupted by early summer rains, mirroring 2022 drifts where scanners nabbed 2.4% arbs on draw-heavy adjusted lines. And in virtual realms, RNG Test sims mimic drifts, training algorithms; one study from Canada's University of Waterloo found simulated scans boosted real-world hit rates by 18%.
These cases underscore the slow burn: profits accrue not from home runs, but compounded edges over marathons.
Navigating Challenges in Test Betting Scans
Bookie limits hit hard after arb hauls—many cap accounts at $5k monthly turnover—yet rotating 20+ sites via VPNs circumvents; gubbed accounts recover with low-stake value plays, per trader forums. Withdrawal delays and currency conversions nibble 1-2%, but crypto books slash that. Regulators like Australia's ACMA enforce transparency, ensuring odds feeds stay reliable for global scans.
Market depth thins on non-marquee Tests, inflating drifts but shrinking stake sizes; still, volume from India Premier League crossovers keeps liquidity humming.
Conclusion
Test cricket's deliberate pace crafts a bettor's paradise for prematch scanners, transforming gradual odds drifts into value troves and arb sureties that build bankrolls brick by brick. Data confirms consistent 3-5% edges for diligent users, especially chaining tools across series; as April 2026 tours approach, with weather wildcards and form flux, scanners stand ready to unearth profits in this timeless game's betting arena. Those who sync scans, calculate stakes, and stake smartly find the slow burn yields the hottest returns.