Mapping Odds Variations Through Aggregator Networks: How Integrated Scanners Pair Value Detection With Instant Calculators to Surface Stable Arbitrage Windows in Global Markets
Data aggregation platforms collect live pricing from hundreds of licensed operators across multiple continents, and these systems create detailed maps of how odds fluctuate in response to market movements and news events. Observers note that by May 2026 the volume of simultaneous data streams processed by leading aggregators had grown substantially compared with earlier years, because operators in Europe, North America, and Asia-Pacific regions expanded their digital offerings. The resulting maps reveal clusters where prices diverge noticeably, and those clusters often align with moments when new information reaches different jurisdictions at slightly different times.
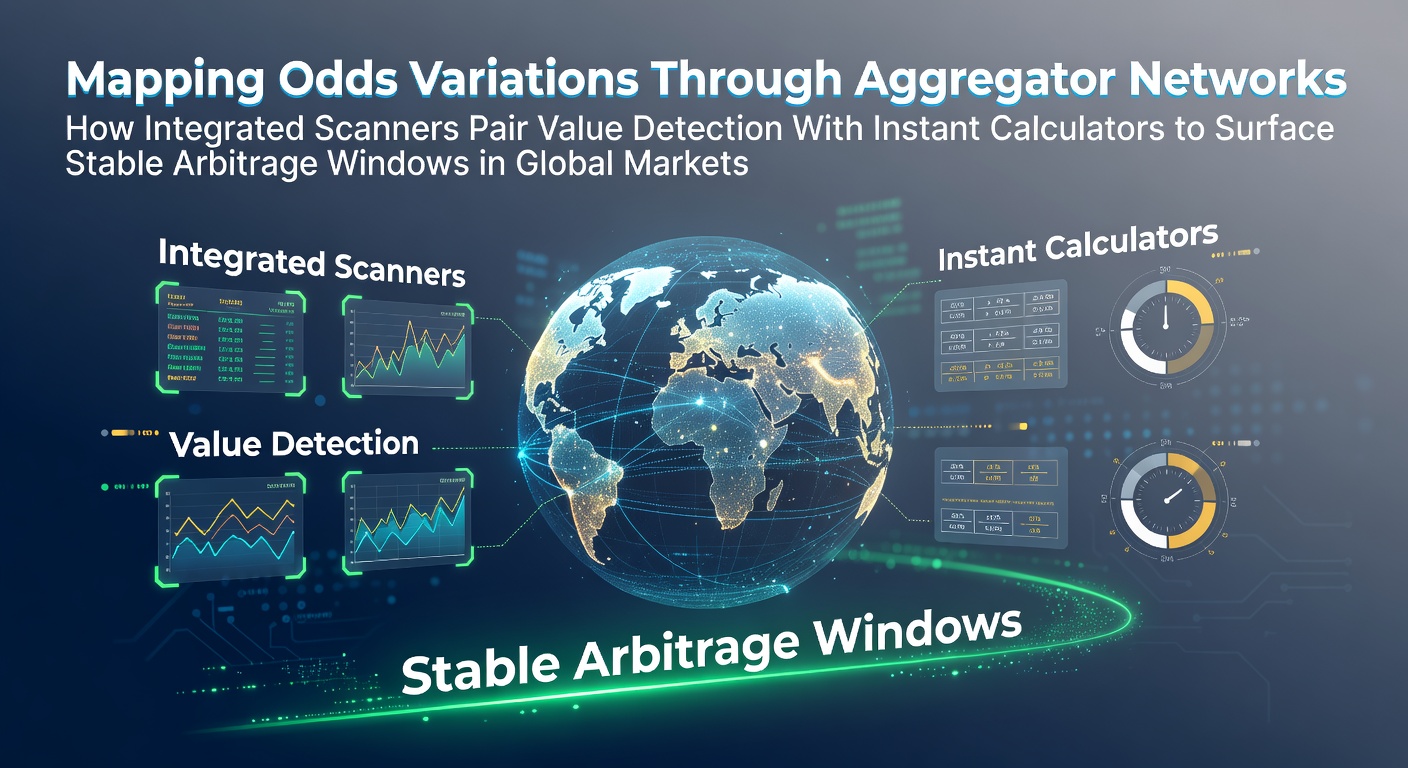
How Aggregator Networks Capture and Organize Global Odds Data
Aggregator services pull feeds directly from bookmakers through application programming interfaces, then normalize the information into standardized formats that scanners can read without delay. Researchers tracking these networks report that the normalization step includes adjustments for currency conversion, stake limits, and regional rules that affect how much a single wager can influence displayed prices. Because the process runs continuously, users receive an updated overview of price spreads every few seconds rather than waiting for manual refreshes. In practice this means a divergence between an Australian exchange and a European bookmaker appears on the same dashboard within moments of the underlying change.
Value Detection Through Integrated Scanning Layers
Scanners compare incoming prices against statistical models that estimate true event probabilities, and any instance where the offered odds exceed the model output triggers an alert labeled as positive expected value. These models draw on historical results, team performance metrics, and external factors such as weather or travel schedules, all updated with the latest available inputs. Data from industry reports indicates that the most effective scanners now incorporate machine-learning adjustments that refine probability estimates after each completed event, which reduces false positives over successive cycles. Users therefore receive fewer but more precise signals, allowing them to focus attention on the opportunities that show the strongest statistical edge.
Instant Calculators Converting Detected Edges Into Executable Arbitrage Positions
Once a scanner flags a potential discrepancy, the paired calculator determines whether the same outcome priced across multiple books can be combined into a risk-free return. The software solves the system of implied probabilities in real time, outputs the exact stake distribution required at each price, and confirms the resulting profit margin before any funds are committed. Because the calculation runs locally on the user device after the aggregator delivers fresh data, latency stays low enough for the quoted prices to remain available during the placement window. Figures released by several North American regulatory bodies show that operators have shortened the average lifetime of large price gaps since 2024, yet the calculators continue to identify smaller but repeatable margins that persist long enough for execution.

Characteristics of Stable Arbitrage Windows in Aggregated Markets
Stable windows emerge when the same price discrepancy appears across at least three independent sources and remains within a narrow tolerance band for several minutes. Aggregator logs analyzed by academic groups at institutions in Canada and Australia demonstrate that these windows occur most frequently during overnight trading sessions when liquidity from Asian markets overlaps with European early-morning activity. The duration of each window depends on the speed at which individual bookmakers adjust their risk engines, and networks that route alerts through multiple geographic nodes tend to surface opportunities before any single operator can close the gap. In May 2026 the average documented window length for major football leagues measured just under four minutes, whereas lower-profile tennis matches sometimes produced windows exceeding eight minutes.
Regional Regulatory Influences on Data Flow and Opportunity Lifespan
Rules governing maximum payout caps and account verification timelines differ between jurisdictions, and these differences directly affect how long an arbitrage window stays open. European operators subject to stricter responsible-gambling reporting requirements often adjust prices more rapidly after large wagers, whereas certain Asia-Pacific exchanges maintain wider spreads for longer periods because their settlement cycles operate on different schedules. According to research published by the Australian Gambling Research Centre, cross-border data sharing agreements introduced in late 2025 have reduced the frequency of extreme price gaps yet increased the number of smaller, recurring discrepancies that calculators can still exploit. Operators therefore face incentives to maintain competitive pricing while complying with local transparency mandates, which in turn shapes the patterns visible on aggregator dashboards.
Practical Workflow From Scan to Confirmed Stake
A typical sequence begins when the aggregator receives updated prices from three or more bookmakers, the scanner compares each line against its probability model, and any qualifying value bet passes to the calculator module. The calculator then solves for the stake vector that equalizes returns across the selected books and displays the net margin alongside the precise amounts to place at each price. Users who maintain funded accounts at the relevant operators can complete the required transactions before the window closes, and automated logging records the outcome for later performance review. Industry associations such as the International Betting Integrity Association have documented that platforms incorporating both scanning and calculation functions report higher completion rates than those offering only raw price feeds.
Conclusion
Aggregator networks continue to evolve by refining data normalization routines and expanding the number of connected operators, while integrated scanners and calculators translate raw price variations into actionable positions that remain viable within tightening market conditions. The patterns observed through May 2026 illustrate that stable arbitrage windows arise from the interaction of regulatory timing differences, liquidity cycles, and algorithmic response speeds rather than from isolated bookmaker errors. Observers tracking these systems expect further compression of opportunity durations as more operators adopt synchronized risk-management protocols, yet the underlying mapping process itself provides the visibility needed to locate remaining margins across global markets.